Streaming Barcode Images in JasperReports iReport Designer
In this tutorial, the Dynamic Barcode Generator Service is used to show how to stream barcodes in Jaspersoft iReport Designer 5.5, and later versions should be a similar process, if not the same. iReport Designer is the free, open-source report designer for JasperReports and JasperReports Server.
iReport and Dynamic Barcode Generator Service Overview
Barcodes can be easily implemented in a report by placing the IDAutomation Barcode Generator Service URL into an image item and setting the URL parameter to a desired field. Scannable barcodes are streamed to the browser or PDF when the report is run.
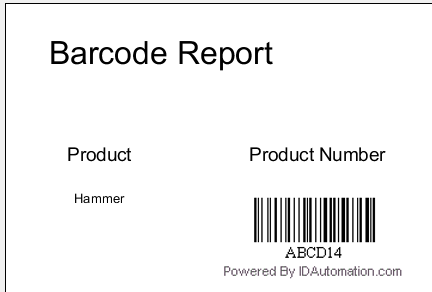
iReport and Dynamic Barcode Generator Service Tutorial
Applications Used in this Tutorial
- This tutorial uses the Free Version of the Dynamic Barcode Generator Service; the purchased version does not include the watermark.
- Jaspersoft iReport Designer 5.5
- Microsoft Excel
Tutorial
NOTE: The tutorial uses iReport Designer 5.5 and an Excel data source to generate a Code 128 barcode based on the Dynamic Barcode Generator Service Demo.
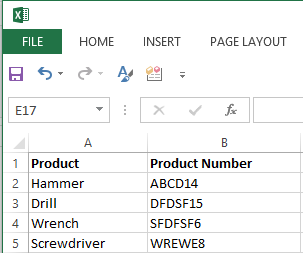
Excel Data Source
- To run Jaspersoft iReport, double-click the
application icon.
- Select File - New. Select Report from the New file options,
choose the template, and select Open this Template.
- Enter a Report name, and the location to save the report, and select Next.
- Select Finish.
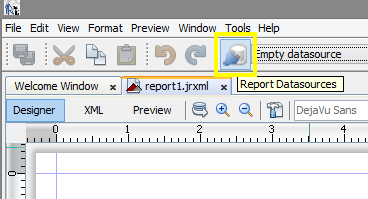
- Select the Report Datasources icon.
-
In the Connections/Datasources dialog box, select New, choose the data source
type to import, and click Next.
-
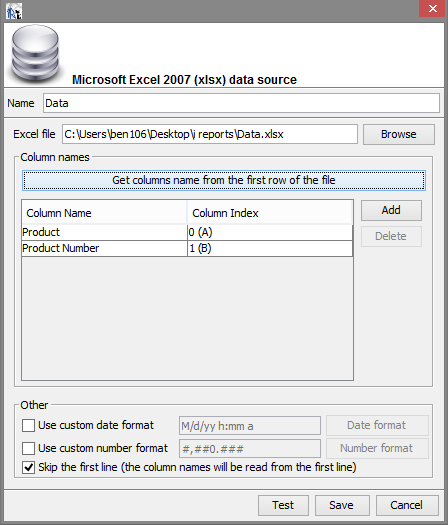
Choose a name for the data source, then select Browse and open the
desired file. To obtain the column name for each row, select Get columns name
from the first row of the file.
-
Choose Save and Close.
-
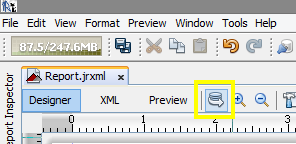
Select the Report query icon.
-
Select the Datasource tab. This tutorial uses Excel Datasource.
-
Select Get fields from the data source and choose OK.
- The report will appear in Design mode. To add the Palette (which includes
report elements), select Window -
Palette.
- Left-click and drag an Image item from the Report Elements to the Detail band
of the report.
A dialog will open, select Cancel. -
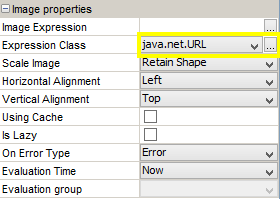
Left-click the Image item, then select Properties on the right side of the application. If the Properties panel options are not visible, select Window - Properties.
- Within the Image properties, set the Expression Class to java.net.URL.
- Select the Image Expression editor button.

Enter new java.net.URL("https://www.bcgen.com/demo/linear-dbgs.aspx?D=" + $F{Product Number}) and select OK.
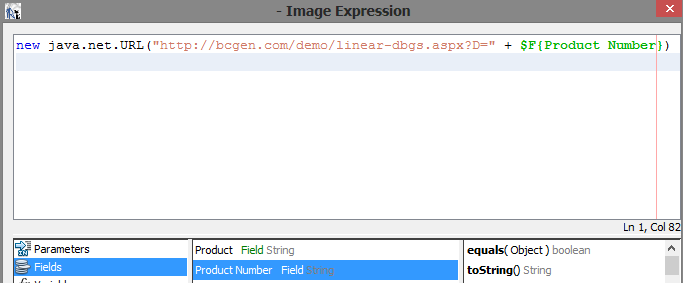
In the example, the Product Number field is set to the DataToEncode (D parameter). To set additional parameters, view the Dynamic Barcode Generator Service parameter table.
- Set up the report title, fields, and column headers.
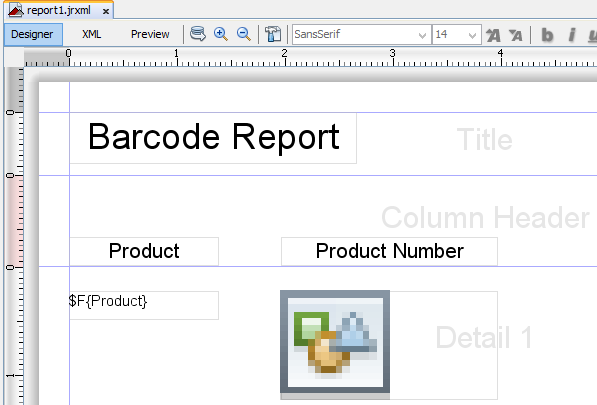
- Save the file.
- To view the report, select the Preview tab.
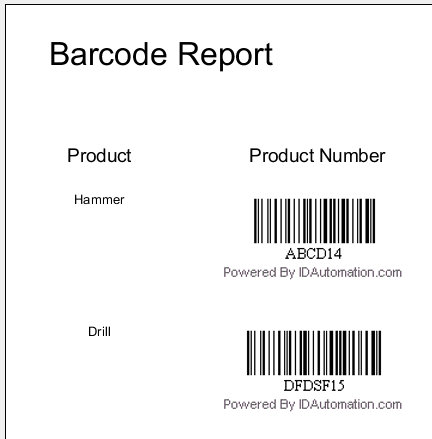
If a scanner is needed, consider purchasing the IDAutomation USB Barcode Scanner.

