Streaming Barcodes in BIRT for Eclipse IDE
Barcodes may be easily placed in Business Intelligence and Reporting Tools (BIRT) for Eclipse IDE with the Dynamic Barcode Generator Service. When using any IDAutomation Web Streaming product to stream barcodes into BIRT, there are no additional fonts or encoders to install. The only requirement is that all machines generating the reports need access to the Internet (or internal intranet, depending on planned scalability). Multiple barcode symbologies are provided by these streaming products, including Code 128, Code 39, GS1 DataBar, USPS Intelligent Mail, UPC, Data Matrix, PDF417, QR-Code, and many more*.
The following is a tutorial to show how to add a barcode image object to BIRT for Eclipse IDE, which requires:
- An IDAutomation
Barcode Streaming Service (Demo or Purchased).
- Business Intelligence and Reporting Tools (BIRT) for Eclipse IDE
* See each streaming service for symbologies supported and implementation details.
IDAutomation Barcode Streaming Services:
Note: For this example, we will use the Code 128 streaming demo due to its popularity. It is assumed that there is an understanding of BIRT for Eclipse IDE, as the following is a quick overview of the integration.
Component-based barcode image streamers:
-
Dynamic Barcode Generator Subscription
(hosted by IDAutomation)
-
Java Barcode Servlet
(hosted locally)
- Streaming Barcode Server for IIS (hosted locally)
Script-based barcode image streamers:
-
ASP Barcode Generator Script
(hosted locally)
-
ASPX Barcode Generator Script
(hosted locally)
- PHP Barcode Generator Script (hosted locally)
Streaming Dynamic Barcode Tutorial
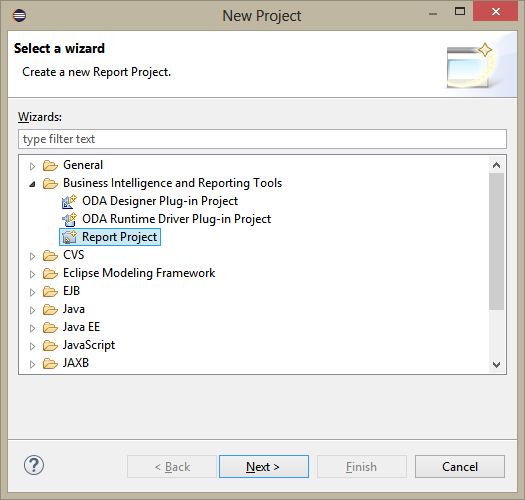
- To open a new project, choose File > New > Project > Business
Intelligence and Reporting Tools > Report Project, select Next, and
choose Project name:
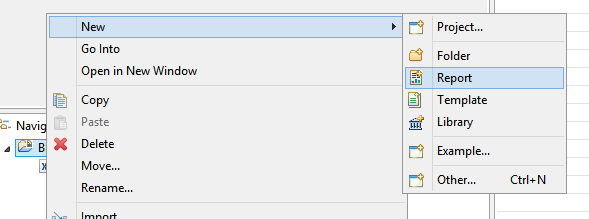
- Right-click the Project in the Navigator panel and go to New > Report to
create a report and save the report, such as new_report.rptdesign:
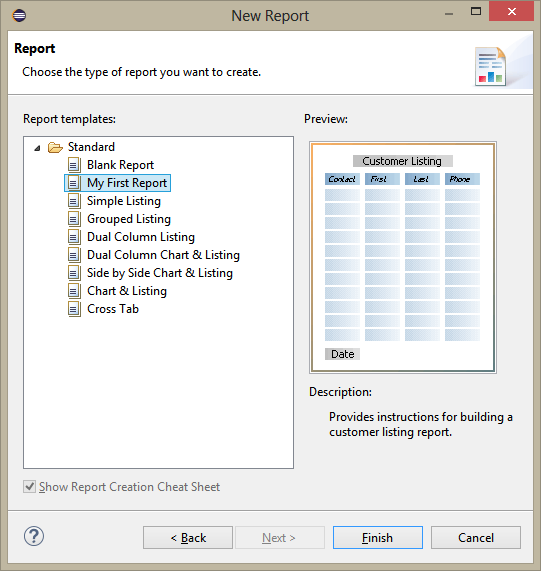
- This example uses one of the built-in reports "My First Report",
which is a customer listing:
- The report is blank at this point:

- Next, attach a data source, this example uses a premade Excel Spreadsheet
with customer information:

- Attach the Customer List Excel Data Source:
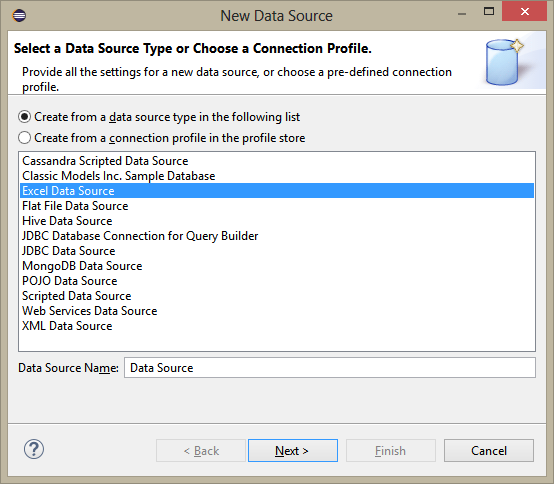
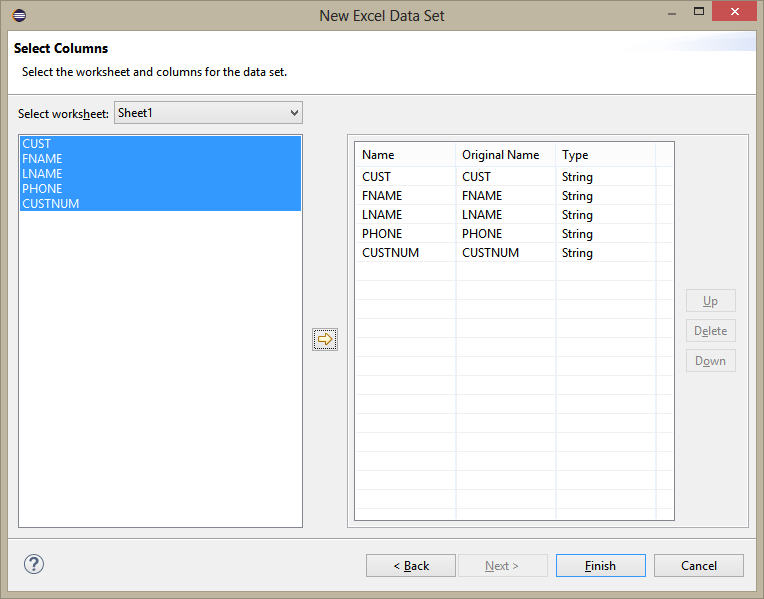
- Right-click "Data Sets" in the Data Explorer panel, choose "New
Data Set", and create a new data set from your data source. On the next
screen, Drag and Drop the items to appear on the report. This screen will
also allow users to edit or change properties as needed:

- Preview the Report (Shown Here: Run > View Report > In Web Viewer):

- The next step is to add the barcode to the report:
- Insert a column to the right, add a label, and call it Barcode.
- Then, below the label, insert an image object:
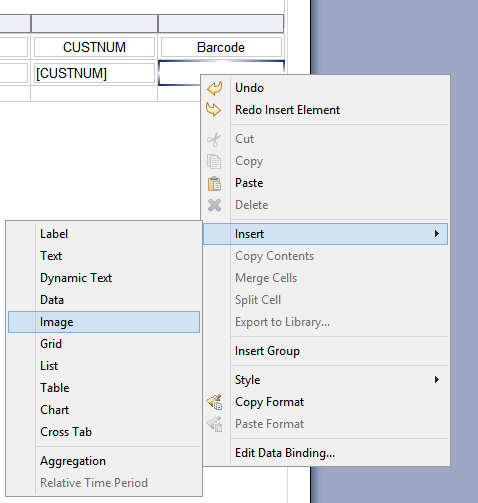
- Choose URI from the 'Edit Image Item' screen to embed
an image.
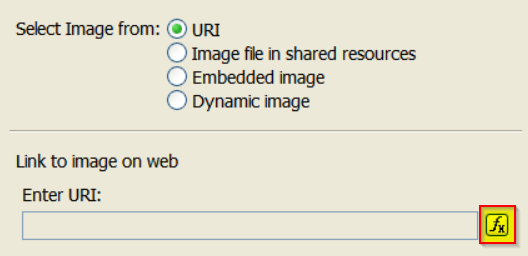
- From the fx dropdown, choose JavaScript Syntax.
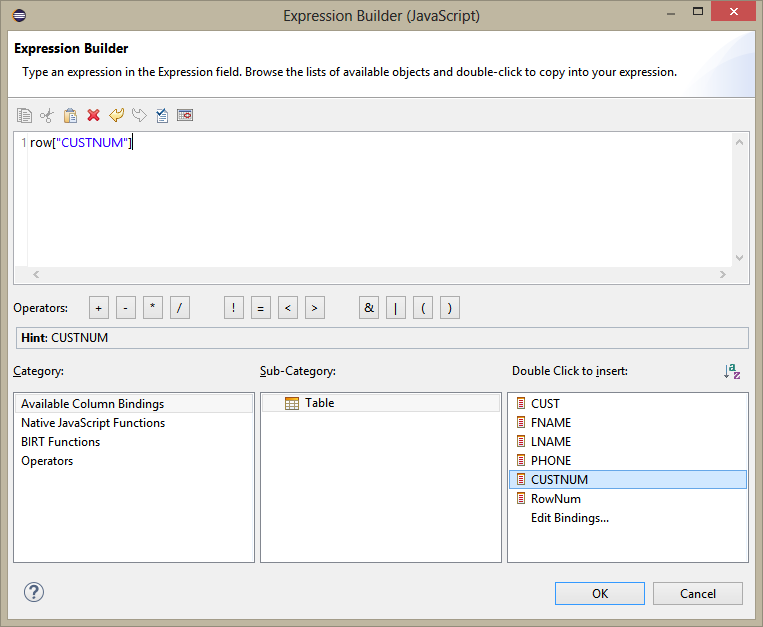
- When the Expression Builder window opens, choose the field(s) to encode in the barcode. In this
example, the
CUSTNUM field from the Table will be encoded:
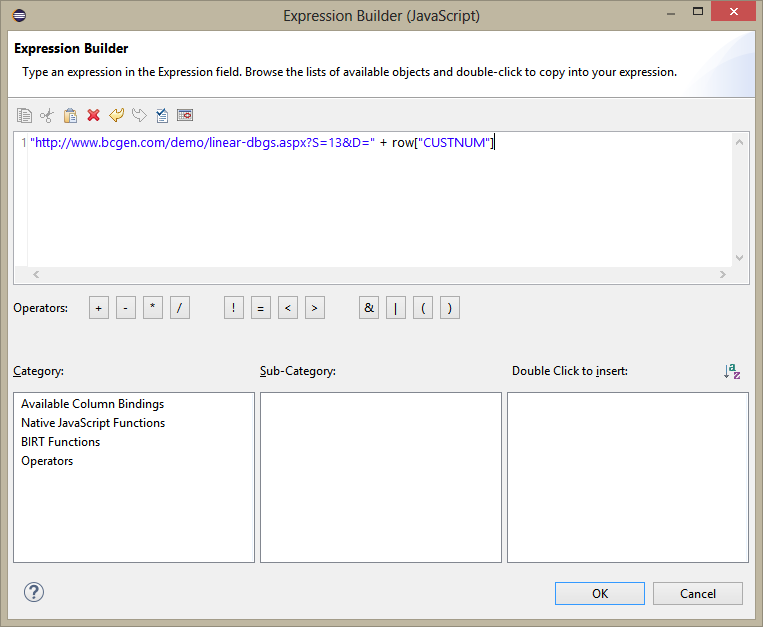
- Now that the field syntax is set up, add the
Dynamic Barcode Generator Service URL (in quotes) ahead of the field and assign the
D=
property to the field,
as in the screenshot below:
- Click Ok twice to close out the editors and save the project.
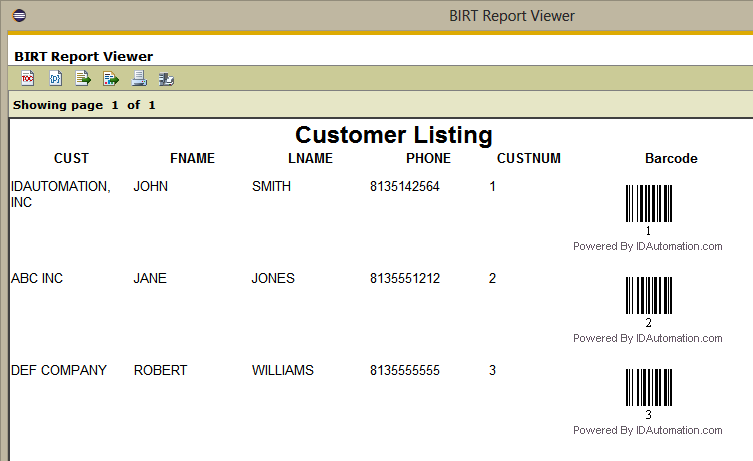
- Run the Report Viewer to verify that the barcodes are
streaming onto the report:
